|
|
Prevailing heavy metal concentrations at nine locations where Ukraine, Hungary, and Romania meet.
642 x 671 jpg
Tabular data below showing concentrations of seven heavy metals (Arsenic, As; Zinc, Zn; Copper, Cu; Lead, Pg; Cadmium, Cd; Iron, Fe; and Manganese, Mn) is adapted from Sarkany-Kiss, A. & Hamar, J. (1999) as presented in Baia Mare Romania, UNEP/OCHA Assessment Mission, March 2000, Table 1, p. 21 www.ausimm.com/societies/baiamare.pdf.
The lowest concentration for each metal (that is, in each column) is rewarded with a blue cell color, which was shared in case of ties. The two highest concentrations in each column were marked in red, and the two next-highest concentrations in yellow.
It is clear that the Ukrainian sampling location, Borzhava, had by far the cleanest water, and four of the Romanian locations by far the dirtiest. As the water at the three Hungarian locations is freshly-arrived from Romania, there is little opportunity for it to improve. Nevertheless, that it has not gotten worse, and has in fact improved, indicates that Hunary is not adding to its toxic load. The Romanian location Ulmeni resembles the three Hungarian locations — it falls between a Ukrainian clean and the typical Romanian heavily contaminated.
The seeming freedom of many sampling locations from Cadmium (Cd) should be understood to mean nothing more than that measurements were insensitive. That is, a collection of "0.00"s does not indicate an absence of Cd, it indicates that available instruments were unable to detect a concentration below 0.0049 mg/L, a serious weakness when the European Commission standard is 0.003 mg/L. Had measurements been possible to the third or fourth decimal place, then the Cd column would likely have revealed the same differences as were evident in the other columns.
| Historical water chemical data of the River Sasar, Lapus, Somes, and Tisza in September 1992. All units are mg/L. The UNEP/OCHA Assessment Mission gives the European Commission's water quality standard for the Rhine River as 0.005 mg/L for Arsenic (As) and for Lead (Pb), and as 0.003 mg/L for Cadmium (Cd). | ||||||||
| COUNTRY | SAMPLING LOCATION | As | Zn | Cu | Pb | Cd | Fe | Mn |
| Romania | Baia Mare | 0.40 | 2.80 | 1.70 | 0.92 | 0.02 | 14.80 | 3.70 |
| Romania | Busag | 0.42 | 3.40 | 2.20 | 0.38 | 0.02 | 14.00 | 2.10 |
| Romania | Cicarlau | 0.36 | 1.50 | 1.60 | 0.32 | 0.01 | 7.30 | 1.20 |
| Romania | Satu Mare | 0.13 | 1.00 | 0.56 | 0.12 | 0.00 | 6.03 | 2.00 |
| Romania | Ulmeni | 0.00 | 0.04 | 0.02 | 0.02 | 0.00 | 1.10 | 0.27 |
| Hungary | Csenger | 0.01 | 0.25 | 0.06 | 0.01 | 0.00 | 1.60 | 0.96 |
| Hungary | Tunyogmatoles | 0.01 | 0.26 | 0.01 | 0.02 | 0.00 | 2.30 | 0.87 |
| Hungary | Aranyosapati | 0.01 | 0.28 | 0.06 | 0.02 | 0.00 | 2.70 | 0.51 |
| Ukraine | Borzhava | 0.00 | 0.05 | 0.00 | 0.00 | 0.00 | 0.38 | 0.06 |
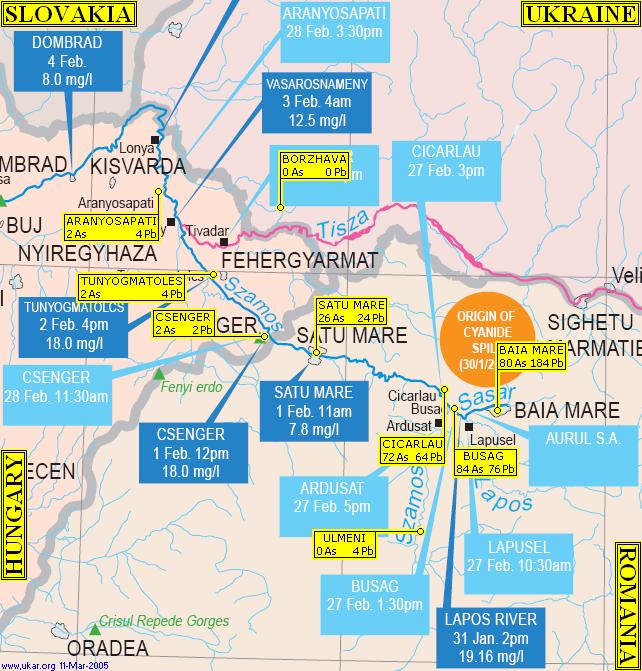
Some of the tabular data has been superimposed below on a detail from a 300X enlargement of MAP: TRACKING TWO SPILLS (which tracked pollution from the 30-Jan-2000 Baia Mare and the 10-Mar-2000 Baia Borsa spills). The seeming complexity of the map vanishes when it is recognized that the original map was adapted here merely because it happened to already locate seven of the nine sampling sites mentioned in the table, and that little more needs to be attended to for present purposes than the contents of the yellow boxes which show the observed Arsenic (As) and Lead (Pb) concentrations as multiples of the European Commission standard of 0.005 mg/L. For example, "80 As" in the yellow Baia Mare box below means that the observed level of 0.40 mg/L evident in the table above is 80 times the European Commission standard of 0.005 mg/L. Presentation of such multiples serves to underline that although the three Hungarian measurements, and the one Romanian measurement at Ulmeni, may have seemed low and harmless when expressed in mg/L, when expressed as a ratio of the European Commission standard, are revealed as being high and dangerous, though of course nothing in comparison with the worst of the Romanian waters.
The map reveals, furthermore, that whereas Ukraine feeds Hungary the Zero As and Zero Pb Borzhava waters, Hungary (through no fault of its own) feeds Ukraine the 2 As and 4 Pb Aranyosapati-measured waters of the Somes (Szamos in this map) which Ukraine can be seen to border at the apex of the Somes.
It is important to note that these are the prevailing concentrations, not gathered in reaction to any spill. A pollution spill escalates the readings to even higher levels.
HOME DISINFORMATION PEOPLE KUCHMA PUTIN YUSHCHENKO DANUBE MAPS